Creating legend of matrix |


|
|
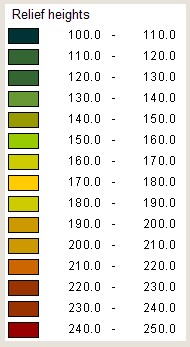
The legend of matrix of heights represents the list of color ranges used at displaying a matrix, with indicating the numerical boundaries of ranges. The number of ranges is equal to number of colors in the palette of matrix of heights.
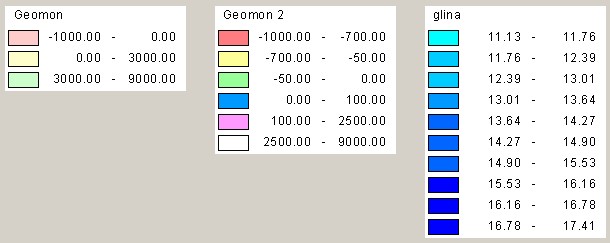
For displaying a matrix of heights the palette is used by default consisting of 32 colors. The maximum number of colors - 256, the minimum number of colors - 1. The palette can be in color or grayscale. The set of colors of a colour palette corresponds to the traditional image of the terrain in cartography: lowlands are depicted by dark green color, the mountains - in brown. Colors of grayscale palette are shades of gray. The matrix of heights is displayed elementwise. Let the number of colors in the palette of a matrix is equal to N. Then to values of heights of a matrix there are put in conformity N ranges of heights, each of which corresponds to the color of a palette. Value of height of the displayed element is included into this or that range by number of which the color of a palette is selected. At joint display of several matrixes the same N ranges correspond to the values of heights of all displayed matrixes, therefore at addition of matrix into the document window, and also at closing the matrix, the boundary values of ranges can change. The palette of displaying a matrix of heights can be changed by means of the button of the main panel Colors (Matrixes bookmark). The total diapason of all displayed matrixes can be changed, by specifying the desired values of diapason borders in the same bookmark, thus, the mode the Fixed diapasons is activated and the heights which not belong to the specified borders are not displayed. Cancellation of the specified fixed diapason is carried out by the button Reset. The palette of displaying a matrix of heights can be changed also by means of item the Map Legend of the Tools menu in which it is necessary to choose the Matrix bookmark. In the window that displays diapasons of heights and colors corresponding to them, it is necessary to choose a diapason by pressing the left mouse button. Then after pressing of the right mouse button to choose the item Change color of the pop-up menu. Legend of matrix of qualities also represents the list of diapasons with indicating the boundary values of quality corresponding to the given diapason. The legend is formed separately for each matrix of qualities as the palette of a matrix of qualities is stored in file MTQ. The palette of a matrix of qualities can contain nonregular diapasons (legends of matrixes Geomon and Geomon 2).
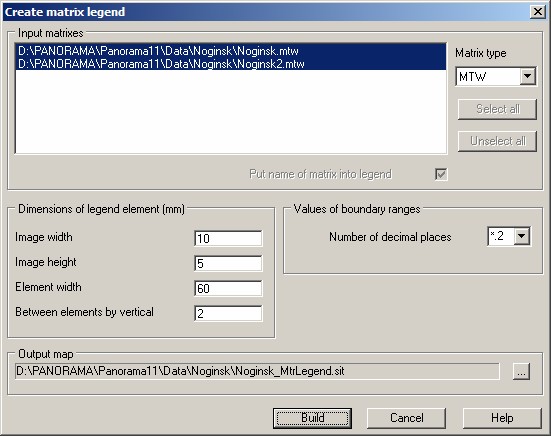
If in the document the matrixes of heights (MTW) and matrixes of qualities (MTQ) are opened, then for a choice of type of input matrixes it is necessary to apply dialog element the Matrix type.
If the type of matrixes MTW is set, then the formed legend corresponds to current settings of the palette of a matrix of heights and does not depend on the number of selected files MTW in window the Input matrixes. If the type of matrixes MTQ is set, then the legend is created for each matrix of qualities selected in window the Input matrixes. At specifying the type of matrixes MTQ the buttons Select all and Unselect all are enabled used for a choice of processed matrixes of qualities. The arrangement of objects on a formed map of a legend is defined by values of parameters in group the Dimensions of legend element, specified in map millimeters. The legend element corresponds to one color of a matrix palette. The legend element contains a rectangle with the image of color of a palette and numerical limits of the appropriate range of values of height or quality. The file name of a formed map of a legend can be set by means of the button «…» in group the Output map. |