Cokriging |


|
|
Cokriging unlike a Kriging at surface modelling uses not only the points in which the modelling characteristic is measured, but also points, in which other characteristic is measured that correlated with the simulated (changing as well as the modeling one). Use of cokriging is justified in those cases when direct measurement of the modelled characteristic with necessary density is impossible or too costly at possibility of cheap measurement of other characteristic correlating with the modelled one. Because in cokriging two characteristics are used, then by them there are constructed three functions of correlation - two functions of autocorrelation for each characteristic and one cross-correlation between them. As a correlating function unlike a Kriging the covariance is used - a function from a difference of deviations from an average.
Covariance is used instead of the variogram because it allows to evaluate the correlation between heterogeneous data at the expense of use of a deviation from an average in a covariance instead of a simple difference in a variogram. Unlike a variogram the covariance can have negative values. At nonzero value of a covariance the data are correlated, at zero - no. For autocovariance the graph always has a downward shape, and for cross-covariances the graph shape depends on that how an additional characteristic correlates relatively the basic one. At direct cross-correlation (at increase in the basic characteristic the additional one also increases) the graph is downward. At negative cross-correlation (at increase in the basic characteristic the additional one will decrease) the graph is increasing.
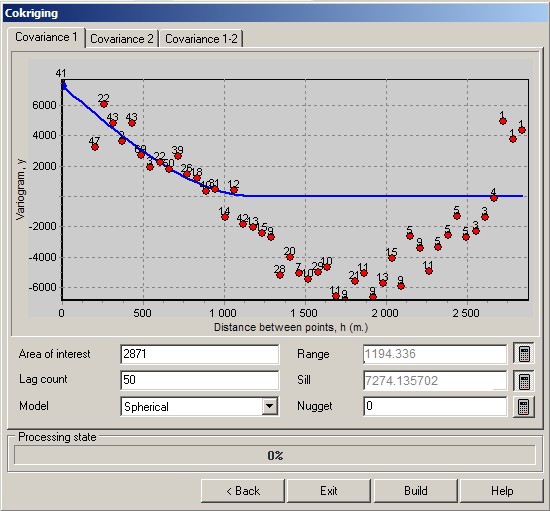
Simulating functions are the same as in kriging, but they are deployed concerning the total value of the threshold (sill) and nugget. On the right the theoretical variogram becomes a horizontal zero straight line in a radius point. Therefore the radius of theoretical model should be chosen in a place of crossing the graph of an empirical variogram with a horizontal line of a zero covariance.
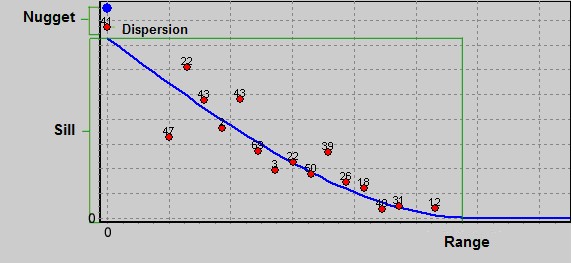
For a variogram in a Kriging the natural limiter of function at the left (for pairs of points with zero mutual distance) is zero, because in the absence of errors the divergence of values of the modeling characteristic in the same point should be equal to zero. For the covariance in general case this value is unknown because it depends on the sample size. Therefore the value of the nugget is harder to determine. For this purpose on the graph of auto-correlation (internal correlation) there is shown value of a covariance for points with zero distance (on the schedule - a point on a zero vertical axis). For such points the covariance degenerates into a dispersion - an average of a square of deviations from an average. This point can use as the upper limiter of covariance, as well as zero is the lower limiter for the variogram (and this is done at the automatic calculation of nugget). For cross-covariance the dispersion can be calculated, if there are measurements of both characteristics on the same points. If such measurements are not present, then there is data for an estimation of a mutual error of diverse measurements, therefore it is more reasonable to set the value of a nugget into zero (if there is no additional data about value of a mutual error). In other respects an order of selection of a theoretical covariance is the same, as well as in a Kriging, only it is performed three times for different graphs of a covariance. After selection of model's parameters the launch of building a matrix is carried out by pressing the Build button. |