Create map legend |


|
|
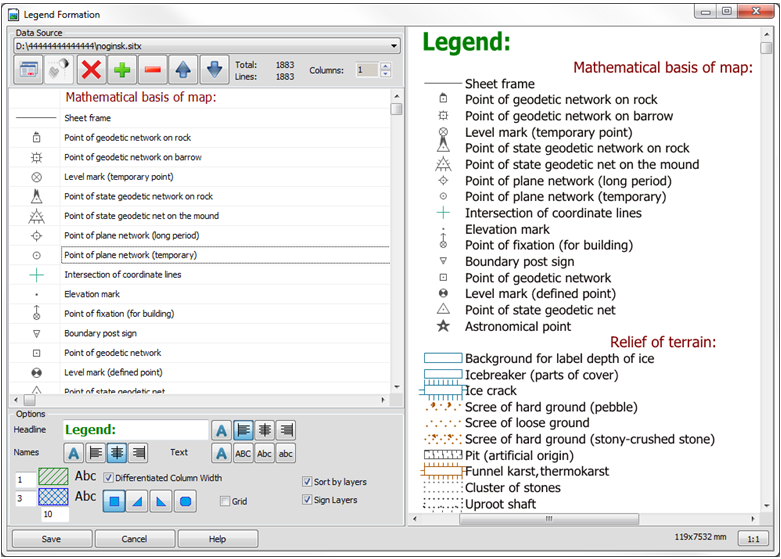
The mode «Create map legend» is intended for creation of legends (tables of conventional symbols of objects used on a map) with possibility of the subsequent implementation of the created images into maps - schemes and reports as an additional information material.
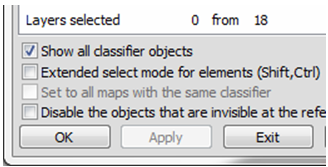
The contents of the legend table can be formed by the objects selected on the map or by setting a filter for the general list of objects contained in the classifier. At startup, the program determines whether there are selected objects on the map. If selected objects are detected, the program forms an initial list with the inclusion of a list of types of selected objects into it. The table of conventional symbols can contain objects included in only one classifier. Therefore if on the open document the objects belonging to different user maps are selected, the list is formed by the first of maps on which there are selected objects. In the future, the map by which the legend is built can be selected in the drop-down list at the top of the dialog box. When you choose a map from the list, if there are selected objects on the chosen map, the symbol table is automatically rebuilt. Otherwise the button «Generate by marked objects» will not be active. When you click the «Generate by marked objects» button again, the table of objects will be generated anew. All changes made to the table will be lost. When you click the «Generate by classifier» button, the «Map object filter» dialog box is activated, using which you can customize the composition of the legend table. Attention! At customizing the filter of objects, the option «Show all objects of classifier» should be enabled!
If at the time of activating the filter, the legend table contained objects, they will be «included» in the filter at starting. If table formation by marked objects or by the classifier filter is carried out at the enabled option «Sort by layers», there is carried out a generating the table of objects sorted by layers of the classifier (in the order they follow in the classifier) and by types (localizations) of objects in sequence: areal, linear, vector, dot, templates, titles. Otherwise table formation is carried out in a sequence order of marked objects (or in a sequence order of objects in the classifier). If the «To sign layers» option is enabled, a line with the name of the layer is added before the sequence of objects of one layer. You can remove the titles of all layers by disabling the corresponding option. You can remove a single name, like any other line, by clicking the corresponding button at the top of the dialog box. When you add a line (insert before the current line of the table), it is added as a title. If you disable the display of layer names, this line will also be deleted. Lines in the table can be added, deleted, changed their position by moving up or down the table, edit the text. Due to the fact that the table may contain several columns (the number is customized at the top of the dialog box), in this case, the line is understood not as the entire line of the table, but the line of the objects list - a pair of cells (a cell with an image and a cell with the object name). In the lower part of the dialog box, additional legend parameters are customized: fonts for the table title, layer names and main titles, image sizes of conventional symbols and line spacing, table grid availability and display options for conventional symbols of polygon objects. When the «Differentiated columns width» option is enabled, the width of each column will be selected according to the maximum size of the contents of this column. When the option will be disabled, all columns will have the same width corresponding to the maximum size of the content throughout the table. In the preview window, you can evaluate the final image of the generated table. Under the preview window, information about the current sizes of the final table in mm is placed, which makes it possible to evaluate the format of the printed sheet on which the formed table will completely fit. The window has standard image management tools: moving while holding the left mouse button, scrolling by rotating the mouse wheel (when pressing the Shift key - horizontal scrolling), scaling by rotating the mouse wheel while holding down the Ctrl key. When you press Ctrl_W, the entire map is positioned in the window. By clicking the Save button, you can save the generated table as a map in SITX format or as a graphic file in JPG format.
|