Table Create |


|
|
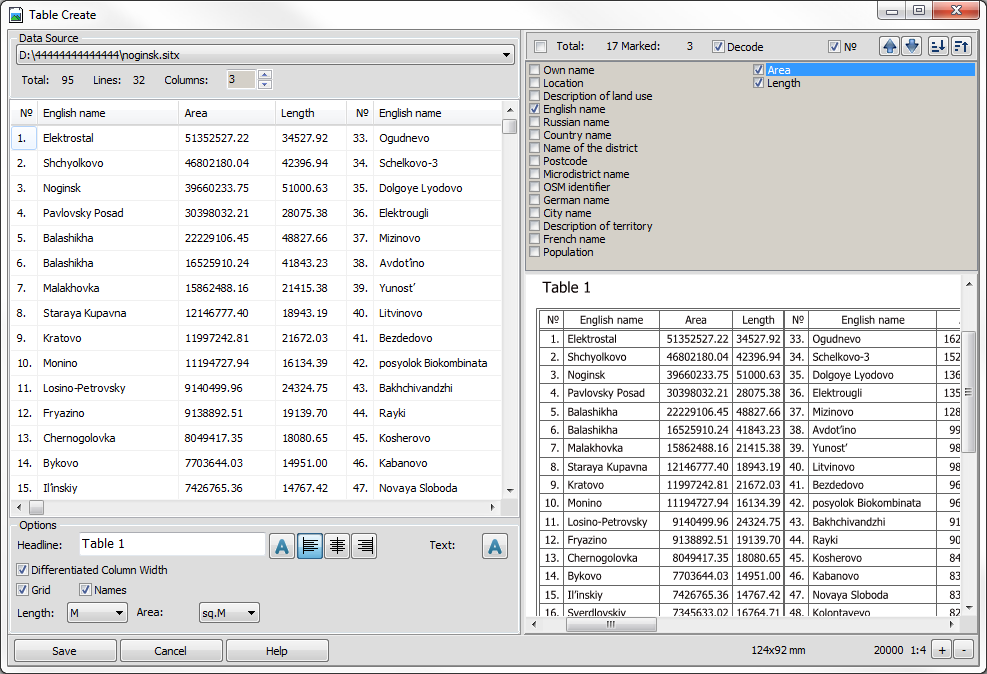
The mode «Table Create» is intended for construction of tables by data received from the attributive and spatial description of map objects with possibility of the subsequent introduction of created tables into maps - the schemes and the reports as an additional information material.
For realisation of possibility of starting the mode it is necessary, that the objects which will participate in table construction have been selected on the map. The dialog window of the mode consists of four main zones:
After the start of the mode, preliminary information processing is performed. If more than 1 000 objects are selected on the map, the program initiates the corresponding message and the operator is invited to either continue execution with the available number of selected objects or refuse to form a table and re-select the objects. In the case of a large number of selected objects, preliminary processing may take some time. The construction of the table is carried out by the objects of one map. If the open map is a project consisting of several maps, the map by which it is necessary to execute table construction, should be selected in the drop-down list in the upper left part of the dialog box. As a result of preliminary processing, a list of possible columns of the generated table is formed. The list includes all semantic characteristics available for at least one of the selected objects. In addition, the Length and Area of the object, which are calculated by the spatial description of the objects, are added into the list. If the objects have semantic characteristics of the same name, they will also be present in the list. In order to distinguish the semantic characteristics from the calculated values, remember that the calculated Length and Area are always located at the end of the list. In addition to the columns whose names are listed in the list of characteristics, the table may contain numbering of lines. Lines numbering is turned on and turned off separately in the header of the characteristics list. In addition to the lines switch, the header of the characteristics list contains statistical information on the total number of characteristics and the number of «switched on» characteristics (characteristics involved in the construction of the table), a general «switch» for all lines, as well as buttons for the columns positioning and values sorting. Using the columns positioning buttons, you can move the current characteristic highlighted in the list, downwards or upwards of the list. Accordingly, in the table, the column will move to the beginning or end of the table. You can sort the table by the current highlighted characteristic in ascending or descending order. Sorting can be performed according to any characteristic, including those that are not used in the formation of the table. For example, you can sort by descending area a table containing only the names of settlements. The header of the table configuration window contains information about the number of lines and columns of the table. The table configuration can be changed by changing the number of columns. A separate column of the table is a set of columns corresponding to the names of the characteristics selected (included) for forming the table. Thus, the total number of columns of the generated table will be equal to the number of columns multiplied by the number of selected characteristics. At the moment of start the table contains one column with columns of numbering, Area and Lengths. The window of customizing the options of displaying the table, located under the table configuration window, contains tools of customizing the text of the table name, customizing fonts for displaying the name and text of the table, tools for and switching-on and off a grid and header of the table, and also a choice of units of measure for displayed the Areas and Lengths of objects. When customizing the font height, the selected size corresponds to the font height on the generated table multiplied by 10. Thus, a font of size 20 will be displayed with a height of 2 mm. At switching-off a grid and header of the table it is possible to create a simple list.
When the «Differentiated Column Width» option is enabled, the width of each column will be selected according to the maximum size of the contents of this column. When the option is disabled, all columns (except for numbering) will have the same width, corresponding to the maximum size of the content throughout the table. In the preview window, you can evaluate the final image of the generated table. Under the preview window, information about the current sizes of the final table in mm is placed, which makes it possible to evaluate the format of the printed sheet on which the formed table will completely fit. By clicking the Create button, you can save the generated table as a map in SITX format, a graphic file in the JPG format, or a text file with CSV delimiters.
|